Plumber Salary in Lynwood, CA: $63,254 (2026)
Quick Answer:A full-time plumber in Lynwood, CA earns a median $63,254/year (≈ $30.41/hour) in nominal terms for 2026 — projected from BLS OEWS 2025 (SOC 47-2152). Once you factor in Lynwood's price level (13% above national, BEA RPP 113.1), that paycheck buys what $55,927 would nationally. Nominal pay sits 3.5% below the California state average.
Based on BLS state-level estimates · View source
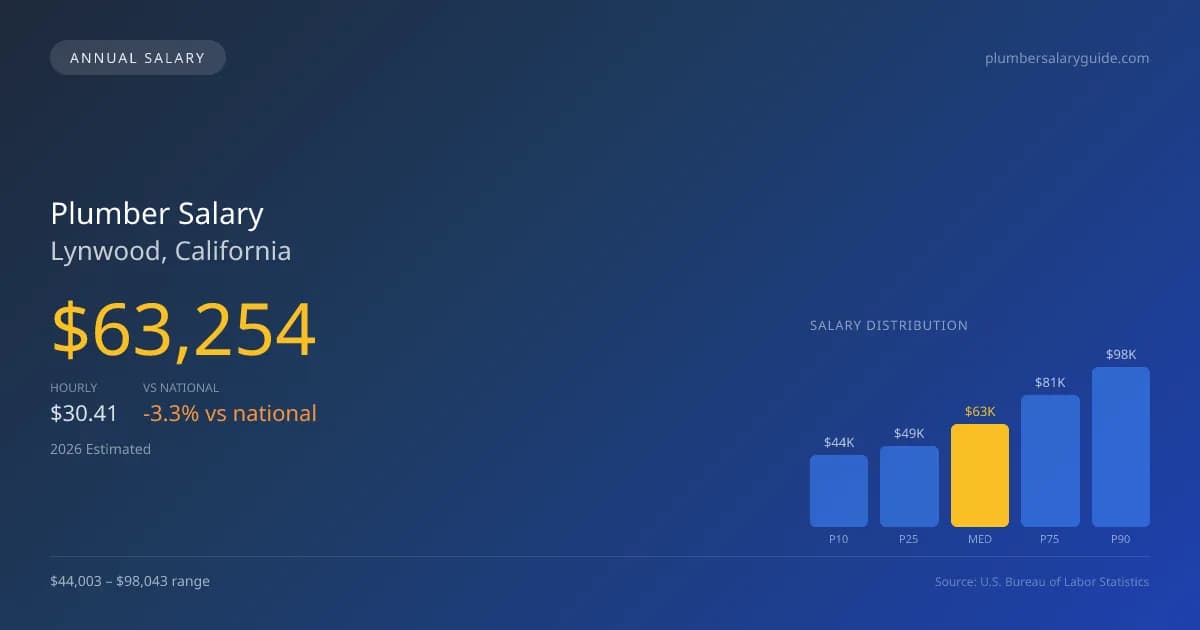
In 2026, plumbers in Lynwood, California, can expect a median annual salary of $63,254, which is slightly below the national median of $65,408. The salary range is broad, with the lowest earners bringing in $44,003 while the top earners can make as much as $98,043. These figures are based on state-level data derived from the Bureau of Labor Statistics (BLS), taking into account regional price parities that reflect the local economy. As Lynwood continues to evolve, the dynamics between self-employed contractors and those employed in service plumbing contribute significantly to salary variations, impacting both job security and income potential.
About the Lynwood Market
Salary estimated from California average ($82,000) adjusted for local cost of living.
Salary Breakdown
| Percentile | Annual | Hourly |
|---|---|---|
| Entry Level (P10) | $44,003 | $21.16 |
| Lower Range (P25) | $49,460 | $23.77 |
| Median (P50)(typical) | $63,254 | $30.41 |
| Upper Range (P75) | $80,965 | $38.93 |
| Top Earners (P90) | $98,043 | $47.14 |
Median Salary Position
3.29% below the national average
2026 Salary Percentile Distribution in Lynwood
In Lynwood, CA, the plumber salary spread from the 10th to 90th percentile is $54,040 (2026 est.). At $63,254, the local median is 3.29% below the national median of $65,408.
Salary Calculator
At 40 hours/week in Lynwood: You'd be in the lower-middle range
How Lynwood Plumber Pay Compares
Lynwood median: $63,254/year (2026)
| Compared To | Median Salary | Lynwood Pays |
|---|---|---|
| California Average | $65,548 | -3.50% less |
| National Average | $65,408 | -3.29% less |
Plumbers in Lynwood, CA earn a median of $63,254 per year (2026 est.), which is 3.29% lower than the national median of $65,408 and 3.50% below the California state average of $65,548.
Cost-of-Living Adjusted Salary
Lynwood has a cost of living 13.10% above the national average.
Adjusted salary = nominal × (100 / CoL index). CoL index: 100 = national average.
Lynwood, CA has a cost-of-living index of 113.1 (above the national average of 100). While the nominal salary of $63,254 is competitive, the higher cost of living reduces purchasing power to an effective $55,927 — a 11.58% reduction.
Compare Purchasing Power
Select a city to see how your salary compares after cost of living
Select a city above to compare purchasing power
2019 BLS Actual
$53,344
2025 BLS Actual
$61,699
2026 Current Est.
$63,254
2019–2027 Growth
+21.6%
Salary Trajectory for Plumbers in Lynwood (2019–2027)
2019–2025: actual BLS OEWS data for this metro area. 2026+: CAGR 2.52% projection.
| Year | Annual Salary | Status |
|---|---|---|
| 2019 | $53,344 | Actual |
| 2020 | $54,475 | Actual |
| 2021 | $57,908 | Actual |
| 2022 | $58,111 | Actual |
| 2023 | $59,523 | Actual |
| 2024 | $89,519 | Actual |
| 2025 | $61,699 | Actual |
| 2026(current) | $63,254 | Estimated |
| 2027 | $64,848 | Projected |
Based on 7 years of BLS OEWS data for the Lynwood metropolitan area, the median plumber salary grew 15.7% from $53,344 (2019) to $61,699 (2025). At a 2.52% compound annual growth rate, salaries are projected to reach $64,848 by 2027 — a total increase of $11,504 (21.57%) from 2019.
Note: Historical values (2019–2025) are actual BLS OEWS figures for the Lynwood metropolitan area, sourced from annual Occupational Employment and Wage Statistics surveys. 2026–2026 figures are current estimates, and 2027 values are projections, calculated using a 2.52% CAGR derived from 7-year BLS historical data. Actual salaries may vary based on employer, experience, certifications, and local market conditions.
Salary by Experience Level
| Experience | Estimated Salary Range |
|---|---|
| 0-2 years (New Graduate) | $44,003 – $49,460 |
| 3-5 years (Mid Career) | $49,460 – $63,254 |
| 5+ years (Experienced) | $63,254 – $80,965 |
| 10+ years (Top Earner) | $80,965 – $98,043 |
Plumber salary ranges estimated from BLS percentile data. Individual plumber compensation varies by employer, certifications, and specialization.
Plumber Job Market in Lynwood
With a total of 16 plumbers employed in the area, competition and the local job market are relatively tight. The cost-of-living index in Lynwood stands at 113.1, which suggests that take-home pay must stretch further than it would in many other areas, affecting purchasing power. Among the various employers, union plumbing contractors associated with the UA command some of the highest wages, given their specialty work and benefits. Conversely, self-employed plumbers may see variable earnings, influenced by job type and contract stability. The wage disparity is also driven by skills, with specialties like medical gas and backflow prevention offering higher pay. For maximizing earnings in Lynwood, pursuing additional credentials and licenses, such as a master contractor license or obtaining specialized skills, can enhance opportunities in this competitive market.
More salary data for Lynwood, CA:
Frequently Asked Questions
How much do plumbers make in Lynwood, CA in 2026?
Is Lynwood, CA a good place to work as a plumber?
Can plumbers make $100K in Lynwood?
What is the cost-of-living adjusted plumber salary in Lynwood?
How much does a plumber make per hour in Lynwood?
Related Pages
Compare Salaries
Career Resources
Nearby Cities in California
Written by Samuel Torres, CWP
Career Analyst
Samuel Torres has 10 years of experience in plumbing. He specializes in residential plumbing systems. He has worked with several home improvement companies.
Methodology & Data Source
Salary figures on this page are 2026 projections based on the Bureau of Labor Statistics Occupational Employment and Wage Statistics (OEWS) survey, May 2026 release. The BLS reported a median annual salary of $61,699 for plumbersin the Lynwood metropolitan area. A 2.52% compound annual growth rate (CAGR), calculated from 6-year national BLS wage trends, was applied to project current 2026 compensation. Percentile ranges (P10–P90) represent the full salary distribution across experience levels and practice settings in this market.
Data Sources & Methodology
Salary data for Lynwood is estimated from official BLS state-level occupational wage data (2025), adjusted for regional cost-of-living differences using BEA RPP (Regional Price Parities).
2026 figures are projected from 2025 BLS data using a compound annual growth rate (CAGR) of 2.52%, derived from historical BLS wage trends for plumbers (SOC 47-2152).
Compiled and verified by Samuel Torres, CWP, a licensed plumber with 10+ years of clinical experience. · View source data at BLS.gov