Plumber Salary in Long Beach, CA: $73,144 (2026)
Quick Answer:A full-time plumber in Long Beach, CA earns a median $73,144/year (≈ $35.16/hour) in nominal terms for 2026 — projected from BLS OEWS 2025 (SOC 47-2152). Once you factor in Long Beach's price level (13% above national, BEA RPP 113.1), that paycheck buys what $64,672 would nationally. Nominal pay sits 11.6% above the California state average.
Based on BLS state-level estimates · View source
In 2026, plumbers in Long Beach, California, can expect a median annual salary of $73,144, reflecting a notable increase compared to the national median of $65,408. The local salary range spans from $46,044 at the 10th percentile to $113,373 at the 90th percentile, indicating significant earning potential depending on experience and specialization. With opportunities for advancement in specialties like medical gas and industrial utilities, which command premium pay, skilled plumbers can significantly elevate their earnings. This salary framework is informed by local estimates derived from BLS state-level data and takes into account regional price parities, illustrating the potential for lucrative positions in the area.
About the Long Beach Market
Salary estimated from California average ($82,000) adjusted for local cost of living.
Salary Breakdown
| Percentile | Annual | Hourly |
|---|---|---|
| Entry Level (P10) | $46,044 | $22.13 |
| Lower Range (P25) | $58,241 | $28.00 |
| Median (P50)(typical) | $73,144 | $35.16 |
| Upper Range (P75) | $93,624 | $45.02 |
| Top Earners (P90) | $113,373 | $54.51 |
Median Salary Position
11.83% above the national average
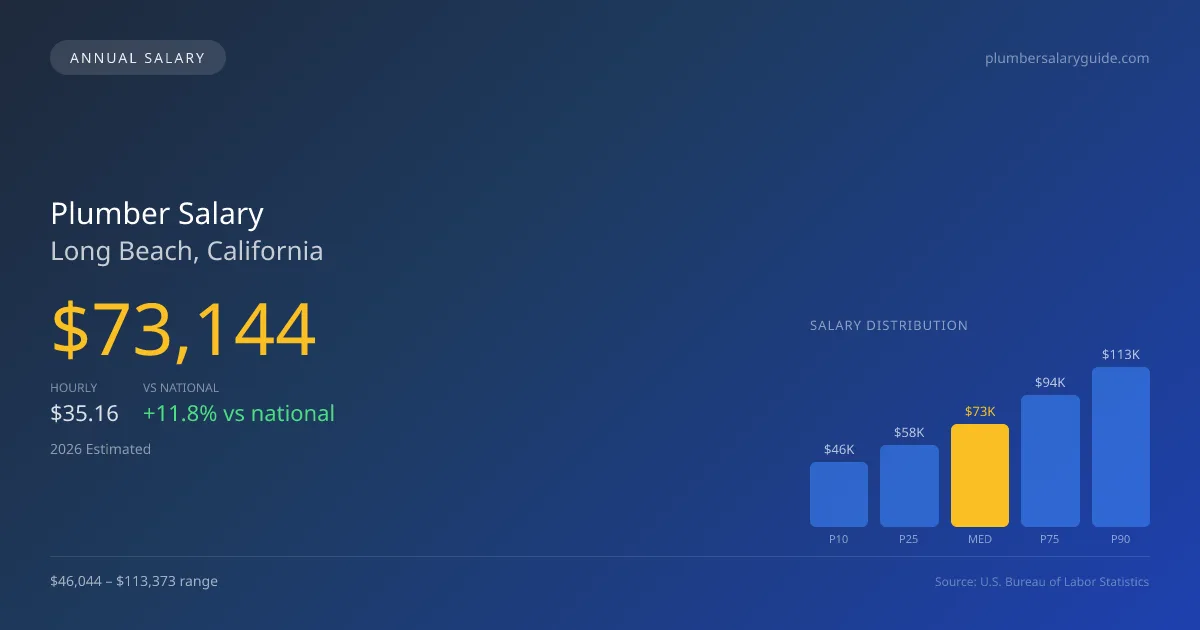
2026 Salary Percentile Distribution in Long Beach
In Long Beach, CA, the plumber salary spread from the 10th to 90th percentile is $67,329 (2026 est.). At $73,144, the local median is 11.83% above the national median of $65,408.
Salary Calculator
At 40 hours/week in Long Beach: You'd be in the lower-middle range
How Long Beach Plumber Pay Compares
Long Beach median: $73,144/year (2026)
| Compared To | Median Salary | Long Beach Pays |
|---|---|---|
| California Average | $65,541 | +11.60% more |
| National Average | $65,408 | +11.83% more |
Plumbers in Long Beach, CA earn a median of $73,144 per year (2026 est.), which is 11.83% higher than the national median of $65,408 and 11.60% above the California state average of $65,541.
Cost-of-Living Adjusted Salary
Long Beach has a cost of living 13.10% above the national average.
Adjusted salary = nominal × (100 / CoL index). CoL index: 100 = national average.
Long Beach, CA has a cost-of-living index of 113.1 (above the national average of 100). While the nominal salary of $73,144 is competitive, the higher cost of living reduces purchasing power to an effective $64,672 — a 11.58% reduction.
Compare Purchasing Power
Select a city to see how your salary compares after cost of living
Select a city above to compare purchasing power
2019 BLS Actual
$61,684
2025 BLS Actual
$71,346
2026 Current Est.
$73,144
2019–2027 Growth
+21.6%
Salary Trajectory for Plumbers in Long Beach (2019–2027)
2019–2025: actual BLS OEWS data for this metro area. 2026+: CAGR 2.52% projection.
| Year | Annual Salary | Status |
|---|---|---|
| 2019 | $61,684 | Actual |
| 2020 | $62,992 | Actual |
| 2021 | $66,962 | Actual |
| 2022 | $67,197 | Actual |
| 2023 | $68,830 | Actual |
| 2024 | $97,702 | Actual |
| 2025 | $71,346 | Actual |
| 2026(current) | $73,144 | Estimated |
| 2027 | $74,987 | Projected |
Based on 7 years of BLS OEWS data for the Long Beach metropolitan area, the median plumber salary grew 15.7% from $61,684 (2019) to $71,346 (2025). At a 2.52% compound annual growth rate, salaries are projected to reach $74,987 by 2027 — a total increase of $13,303 (21.57%) from 2019.
Note: Historical values (2019–2025) are actual BLS OEWS figures for the Long Beach metropolitan area, sourced from annual Occupational Employment and Wage Statistics surveys. 2026–2026 figures are current estimates, and 2027 values are projections, calculated using a 2.52% CAGR derived from 7-year BLS historical data. Actual salaries may vary based on employer, experience, certifications, and local market conditions.
Salary by Experience Level
| Experience | Estimated Salary Range |
|---|---|
| 0-2 years (New Graduate) | $46,044 – $58,241 |
| 3-5 years (Mid Career) | $58,241 – $73,144 |
| 5+ years (Experienced) | $73,144 – $93,624 |
| 10+ years (Top Earner) | $93,624 – $113,373 |
Plumber salary ranges estimated from BLS percentile data. Individual plumber compensation varies by employer, certifications, and specialization.
Plumber Job Market in Long Beach
The plumber job market in Long Beach is supported by approximately 89 local professionals, which reflects a healthy demand for skilled trades in the community. However, the cost of living index stands at 113.1, above the national average, meaning that take-home pay needs to be carefully managed. Among the highest-paying employers are union plumbing contractors affiliated with UA (United Association), which generally offer competitive wages that can be 30-50% higher than those in non-union settings. Additionally, specialized roles in medical gas and industrial maintenance offer further financial benefits. To maximize earnings in this dynamic market, plumbers should consider pursuing additional certifications, such as backflow prevention credentials, and leverage union benefits while also exploring opportunities with larger service companies that may offer commission structures and overtime for additional income.
More salary data for Long Beach, CA:
Frequently Asked Questions
How much do plumbers make in Long Beach, CA in 2026?
Is Long Beach, CA a good place to work as a plumber?
Can plumbers make $100K in Long Beach?
What is the cost-of-living adjusted plumber salary in Long Beach?
How much does a plumber make per hour in Long Beach?
Related Pages
Compare Salaries
Career Resources
Nearby Cities in California
Written by Samuel Torres, CWP
Career Analyst
Samuel Torres has 10 years of experience in plumbing. He specializes in residential plumbing systems. He has worked with several home improvement companies.
Methodology & Data Source
Salary figures on this page are 2026 projections based on the Bureau of Labor Statistics Occupational Employment and Wage Statistics (OEWS) survey, May 2026 release. The BLS reported a median annual salary of $71,346 for plumbersin the Long Beach metropolitan area. A 2.52% compound annual growth rate (CAGR), calculated from 6-year national BLS wage trends, was applied to project current 2026 compensation. Percentile ranges (P10–P90) represent the full salary distribution across experience levels and practice settings in this market.
Data Sources & Methodology
Salary data for Long Beach is estimated from official BLS state-level occupational wage data (2025), adjusted for regional cost-of-living differences using BEA RPP (Regional Price Parities).
2026 figures are projected from 2025 BLS data using a compound annual growth rate (CAGR) of 2.52%, derived from historical BLS wage trends for plumbers (SOC 47-2152).
Compiled and verified by Samuel Torres, CWP, a licensed plumber with 10+ years of clinical experience. · View source data at BLS.gov