Plumber Salary in Livermore, CA: $64,572 (2026)
Quick Answer:A full-time plumber in Livermore, CA earns a median $64,572/year (≈ $31.04/hour) in nominal terms for 2026 — projected from BLS OEWS 2025 (SOC 47-2152). Once you factor in Livermore's price level (13% above national, BEA RPP 113.1), that paycheck buys what $57,093 would nationally. Nominal pay sits 1.5% below the California state average.
Based on BLS state-level estimates · View source
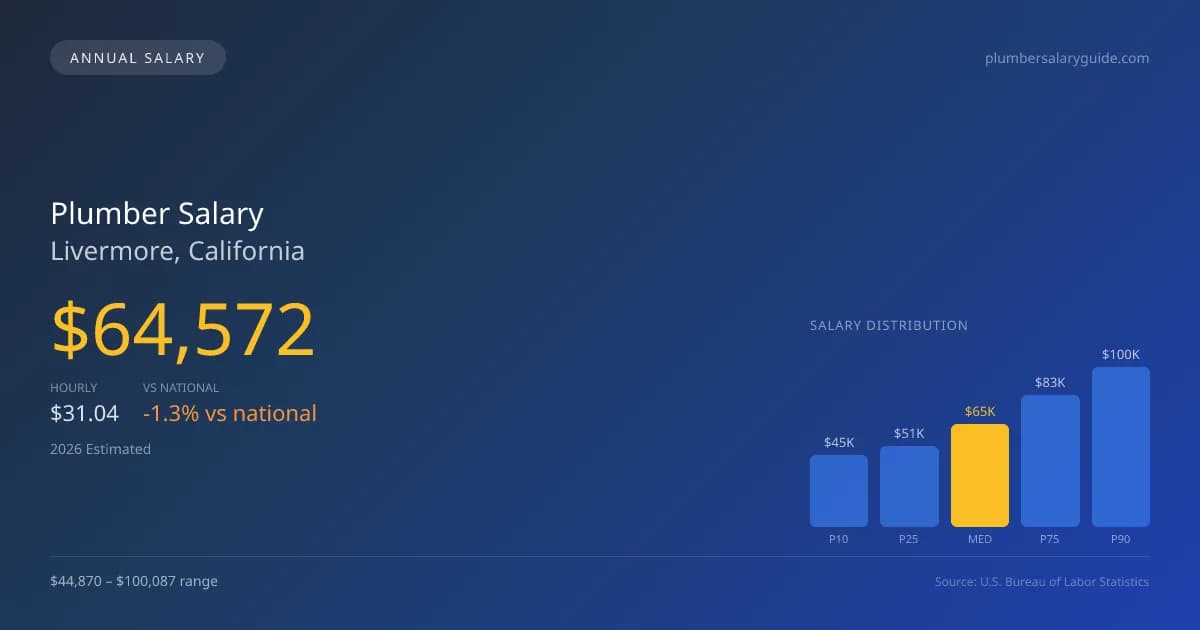
Plumber salaries in Livermore, California, present a complex picture influenced significantly by union affiliations. In 2026, plumbers can expect a median annual salary of $64,572, which falls slightly below the national median of $65,408. The salary range extends from $44,870 at the 10th percentile to $100,087 at the 90th percentile, illustrating substantial variability based on experience and specialization. Estimates derived from 2025 BLS data, adjusted for regional price parities, indicate that unionized pipefitters tend to earn significantly more than their non-union counterparts, with some union roles offering a premium of 30-50%. This dynamic plays a crucial role in Livermore's job market, making union membership a substantial factor for those looking to maximize their compensation.
About the Livermore Market
Salary estimated from California average ($82,000) adjusted for local cost of living.
Salary Breakdown
| Percentile | Annual | Hourly |
|---|---|---|
| Entry Level (P10) | $44,870 | $21.57 |
| Lower Range (P25) | $50,652 | $24.35 |
| Median (P50)(typical) | $64,572 | $31.04 |
| Upper Range (P75) | $82,653 | $39.74 |
| Top Earners (P90) | $100,087 | $48.12 |
Median Salary Position
1.28% below the national average
2026 Salary Percentile Distribution in Livermore
In Livermore, CA, the plumber salary spread from the 10th to 90th percentile is $55,217 (2026 est.). At $64,572, the local median is 1.28% below the national median of $65,408.
Salary Calculator
At 40 hours/week in Livermore: You'd be in the lower-middle range
How Livermore Plumber Pay Compares
Livermore median: $64,572/year (2026)
| Compared To | Median Salary | Livermore Pays |
|---|---|---|
| California Average | $65,556 | -1.50% less |
| National Average | $65,408 | -1.28% less |
Plumbers in Livermore, CA earn a median of $64,572 per year (2026 est.), which is 1.28% lower than the national median of $65,408 and 1.50% below the California state average of $65,556.
Cost-of-Living Adjusted Salary
Livermore has a cost of living 13.10% above the national average.
Adjusted salary = nominal × (100 / CoL index). CoL index: 100 = national average.
Livermore, CA has a cost-of-living index of 113.1 (above the national average of 100). While the nominal salary of $64,572 is competitive, the higher cost of living reduces purchasing power to an effective $57,093 — a 11.58% reduction.
Compare Purchasing Power
Select a city to see how your salary compares after cost of living
Select a city above to compare purchasing power
2019 BLS Actual
$54,455
2025 BLS Actual
$62,985
2026 Current Est.
$64,572
2019–2027 Growth
+21.6%
Salary Trajectory for Plumbers in Livermore (2019–2027)
2019–2025: actual BLS OEWS data for this metro area. 2026+: CAGR 2.52% projection.
| Year | Annual Salary | Status |
|---|---|---|
| 2019 | $54,455 | Actual |
| 2020 | $55,610 | Actual |
| 2021 | $59,115 | Actual |
| 2022 | $59,322 | Actual |
| 2023 | $60,764 | Actual |
| 2024 | $91,385 | Actual |
| 2025 | $62,985 | Actual |
| 2026(current) | $64,572 | Estimated |
| 2027 | $66,199 | Projected |
Based on 7 years of BLS OEWS data for the Livermore metropolitan area, the median plumber salary grew 15.7% from $54,455 (2019) to $62,985 (2025). At a 2.52% compound annual growth rate, salaries are projected to reach $66,199 by 2027 — a total increase of $11,744 (21.57%) from 2019.
Note: Historical values (2019–2025) are actual BLS OEWS figures for the Livermore metropolitan area, sourced from annual Occupational Employment and Wage Statistics surveys. 2026–2026 figures are current estimates, and 2027 values are projections, calculated using a 2.52% CAGR derived from 7-year BLS historical data. Actual salaries may vary based on employer, experience, certifications, and local market conditions.
Salary by Experience Level
| Experience | Estimated Salary Range |
|---|---|
| 0-2 years (New Graduate) | $44,870 – $50,652 |
| 3-5 years (Mid Career) | $50,652 – $64,572 |
| 5+ years (Experienced) | $64,572 – $82,653 |
| 10+ years (Top Earner) | $82,653 – $100,087 |
Plumber salary ranges estimated from BLS percentile data. Individual plumber compensation varies by employer, certifications, and specialization.
Plumber Job Market in Livermore
With only 21 plumbers currently employed in Livermore, the local job market is relatively small, yet it reflects strong demand driven by both an aging workforce and aging infrastructure requiring updates. The cost-of-living index in Livermore is 113.1, meaning that while salaries may not always keep pace with the national median, the purchasing power for plumbers can be impacted by local economic conditions. Employers that typically pay the most include union plumbing contractors, particularly those associated with UA (United Association). Additionally, specialized roles—such as those in medical gas installation—offer better pay opportunities due to their limited workforce. To maximize earnings in this market, plumbers should consider obtaining advanced licenses, pursuing in-demand specialties, and exploring opportunities within larger service companies that may provide commission structures and overtime pay.
More salary data for Livermore, CA:
Frequently Asked Questions
How much do plumbers make in Livermore, CA in 2026?
Is Livermore, CA a good place to work as a plumber?
Can plumbers make $100K in Livermore?
What is the cost-of-living adjusted plumber salary in Livermore?
How much does a plumber make per hour in Livermore?
Related Pages
Compare Salaries
Career Resources
Nearby Cities in California
Written by Samuel Torres, CWP
Career Analyst
Samuel Torres has 10 years of experience in plumbing. He specializes in residential plumbing systems. He has worked with several home improvement companies.
Methodology & Data Source
Salary figures on this page are 2026 projections based on the Bureau of Labor Statistics Occupational Employment and Wage Statistics (OEWS) survey, May 2026 release. The BLS reported a median annual salary of $62,985 for plumbersin the Livermore metropolitan area. A 2.52% compound annual growth rate (CAGR), calculated from 6-year national BLS wage trends, was applied to project current 2026 compensation. Percentile ranges (P10–P90) represent the full salary distribution across experience levels and practice settings in this market.
Data Sources & Methodology
Salary data for Livermore is estimated from official BLS state-level occupational wage data (2025), adjusted for regional cost-of-living differences using BEA RPP (Regional Price Parities).
2026 figures are projected from 2025 BLS data using a compound annual growth rate (CAGR) of 2.52%, derived from historical BLS wage trends for plumbers (SOC 47-2152).
Compiled and verified by Samuel Torres, CWP, a licensed plumber with 10+ years of clinical experience. · View source data at BLS.gov