Plumber Salary in Hayward, CA: $66,390 (2026)
Quick Answer:A full-time plumber in Hayward, CA earns a median $66,390/year (≈ $31.91/hour) in nominal terms for 2026 — projected from BLS OEWS 2025 (SOC 47-2152). Once you factor in Hayward's price level (13% above national, BEA RPP 113.1), that paycheck buys what $58,700 would nationally. Nominal pay sits 1.3% above the California state average.
Based on BLS state-level estimates · View source
In Hayward, California, the dynamics of plumber compensation highlight a marked distinction between union and non-union work. The projected median annual salary for plumbers is $66,390 in 2026, slightly above the national median of $65,408, reflecting the competitive nature of the local market. Plumber pay in Hayward, CA, shows a wide salary range, with entry-level positions earning around $42,929 and top earners making up to $102,904 annually. These estimates stem from 2025 BLS data, adjusted for regional price levels, underscoring the importance of union affiliations in this market, as UA union pipefitters typically secure higher wages compared to their non-union counterparts. The pay gap emphasizes the benefits of obtaining union membership in securing better opportunities.
About the Hayward Market
Salary estimated from California average ($82,000) adjusted for local cost of living.
Salary Breakdown
| Percentile | Annual | Hourly |
|---|---|---|
| Entry Level (P10) | $42,929 | $20.64 |
| Lower Range (P25) | $53,616 | $25.77 |
| Median (P50)(typical) | $66,390 | $31.91 |
| Upper Range (P75) | $84,979 | $40.85 |
| Top Earners (P90) | $102,904 | $49.48 |
Median Salary Position
1.50% above the national average
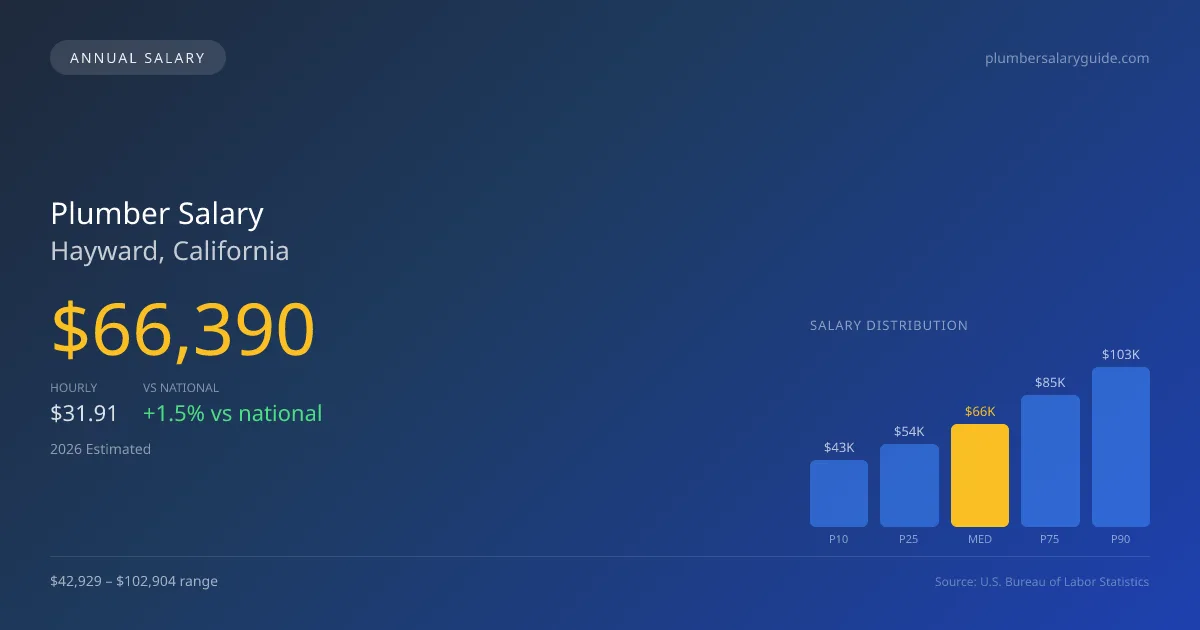
2026 Salary Percentile Distribution in Hayward
In Hayward, CA, the plumber salary spread from the 10th to 90th percentile is $59,975 (2026 est.). At $66,390, the local median is 1.5% above the national median of $65,408.
Salary Calculator
At 40 hours/week in Hayward: You'd be in the lower-middle range
How Hayward Plumber Pay Compares
Hayward median: $66,390/year (2026)
| Compared To | Median Salary | Hayward Pays |
|---|---|---|
| California Average | $65,538 | +1.30% more |
| National Average | $65,408 | +1.50% more |
Plumbers in Hayward, CA earn a median of $66,390 per year (2026 est.), which is 1.50% higher than the national median of $65,408 and 1.30% above the California state average of $65,538.
Cost-of-Living Adjusted Salary
Hayward has a cost of living 13.10% above the national average.
Adjusted salary = nominal × (100 / CoL index). CoL index: 100 = national average.
Hayward, CA has a cost-of-living index of 113.1 (above the national average of 100). While the nominal salary of $66,390 is competitive, the higher cost of living reduces purchasing power to an effective $58,700 — a 11.58% reduction.
Compare Purchasing Power
Select a city to see how your salary compares after cost of living
Select a city above to compare purchasing power
2019 BLS Actual
$55,988
2025 BLS Actual
$64,758
2026 Current Est.
$66,390
2019–2027 Growth
+21.6%
Salary Trajectory for Plumbers in Hayward (2019–2027)
2019–2025: actual BLS OEWS data for this metro area. 2026+: CAGR 2.52% projection.
| Year | Annual Salary | Status |
|---|---|---|
| 2019 | $55,988 | Actual |
| 2020 | $57,176 | Actual |
| 2021 | $60,779 | Actual |
| 2022 | $60,992 | Actual |
| 2023 | $62,474 | Actual |
| 2024 | $93,958 | Actual |
| 2025 | $64,758 | Actual |
| 2026(current) | $66,390 | Estimated |
| 2027 | $68,063 | Projected |
Based on 7 years of BLS OEWS data for the Hayward metropolitan area, the median plumber salary grew 15.7% from $55,988 (2019) to $64,758 (2025). At a 2.52% compound annual growth rate, salaries are projected to reach $68,063 by 2027 — a total increase of $12,075 (21.57%) from 2019.
Note: Historical values (2019–2025) are actual BLS OEWS figures for the Hayward metropolitan area, sourced from annual Occupational Employment and Wage Statistics surveys. 2026–2026 figures are current estimates, and 2027 values are projections, calculated using a 2.52% CAGR derived from 7-year BLS historical data. Actual salaries may vary based on employer, experience, certifications, and local market conditions.
Salary by Experience Level
| Experience | Estimated Salary Range |
|---|---|
| 0-2 years (New Graduate) | $42,929 – $53,616 |
| 3-5 years (Mid Career) | $53,616 – $66,390 |
| 5+ years (Experienced) | $66,390 – $84,979 |
| 10+ years (Top Earner) | $84,979 – $102,904 |
Plumber salary ranges estimated from BLS percentile data. Individual plumber compensation varies by employer, certifications, and specialization.
Plumber Job Market in Hayward
Locally, there are currently 23 employed plumbers within Hayward, indicating a small but steady demand for plumbing services. The cost of living index in the area sits at 113.1, higher than the national average, which may affect take-home purchasing power for plumbers. Notably, employers such as UA-affiliated plumbing contractors often offer the best compensation in the area, while non-union and residential service companies may pay less but offer different incentives like commission-based earnings through companies such as Roto-Rooter and ARS. Factors influencing pay disparities include specialization in areas like medical gas or backflow prevention, the level of licensing (master and contractor licenses), and the working structures of self-employed plumbers. Understanding these factors is crucial for those in the field to maximize their earning potential, particularly in a competitive market like Hayward.
More salary data for Hayward, CA:
Frequently Asked Questions
How much do plumbers make in Hayward, CA in 2026?
Is Hayward, CA a good place to work as a plumber?
Can plumbers make $100K in Hayward?
What is the cost-of-living adjusted plumber salary in Hayward?
How much does a plumber make per hour in Hayward?
Related Pages
Compare Salaries
Career Resources
Nearby Cities in California
Written by Samuel Torres, CWP
Career Analyst
Samuel Torres has 10 years of experience in plumbing. He specializes in residential plumbing systems. He has worked with several home improvement companies.
Methodology & Data Source
Salary figures on this page are 2026 projections based on the Bureau of Labor Statistics Occupational Employment and Wage Statistics (OEWS) survey, May 2026 release. The BLS reported a median annual salary of $64,758 for plumbersin the Hayward metropolitan area. A 2.52% compound annual growth rate (CAGR), calculated from 6-year national BLS wage trends, was applied to project current 2026 compensation. Percentile ranges (P10–P90) represent the full salary distribution across experience levels and practice settings in this market.
Data Sources & Methodology
Salary data for Hayward is estimated from official BLS state-level occupational wage data (2025), adjusted for regional cost-of-living differences using BEA RPP (Regional Price Parities).
2026 figures are projected from 2025 BLS data using a compound annual growth rate (CAGR) of 2.52%, derived from historical BLS wage trends for plumbers (SOC 47-2152).
Compiled and verified by Samuel Torres, CWP, a licensed plumber with 10+ years of clinical experience. · View source data at BLS.gov