Plumber Salary in Gilroy, CA: $65,558 (2026)
Quick Answer:A full-time plumber in Gilroy, CA earns a median $65,558/year (≈ $31.51/hour) in nominal terms for 2026 — projected from BLS OEWS 2025 (SOC 47-2152). Once you factor in Gilroy's price level (13% above national, BEA RPP 113.1), that paycheck buys what $57,965 would nationally. Nominal pay sits 0.0% above the California state average.
Based on BLS state-level estimates · View source
In Gilroy, California, plumbers earn a median annual salary of $65,558 in 2026, which is slightly above the national median of $65,408. The salary range for this occupation spans from $44,087 at the low end (P10) to $101,616 for the highest earners (P90). These figures are derived from estimates based on 2025 BLS data, adjusted for regional price parities. A significant factor influencing compensation in this region is the presence of unionized workers, particularly those in pipefitting roles, which tend to command higher wages compared to non-union plumbers. This union presence creates a competitive edge in the market, driving demand for skilled labor amidst an aging workforce.
About the Gilroy Market
Salary estimated from California average ($82,000) adjusted for local cost of living.
Salary Breakdown
| Percentile | Annual | Hourly |
|---|---|---|
| Entry Level (P10) | $44,087 | $21.19 |
| Lower Range (P25) | $50,123 | $24.10 |
| Median (P50)(typical) | $65,558 | $31.51 |
| Upper Range (P75) | $83,915 | $40.34 |
| Top Earners (P90) | $101,616 | $48.85 |
Median Salary Position
0.23% above the national average
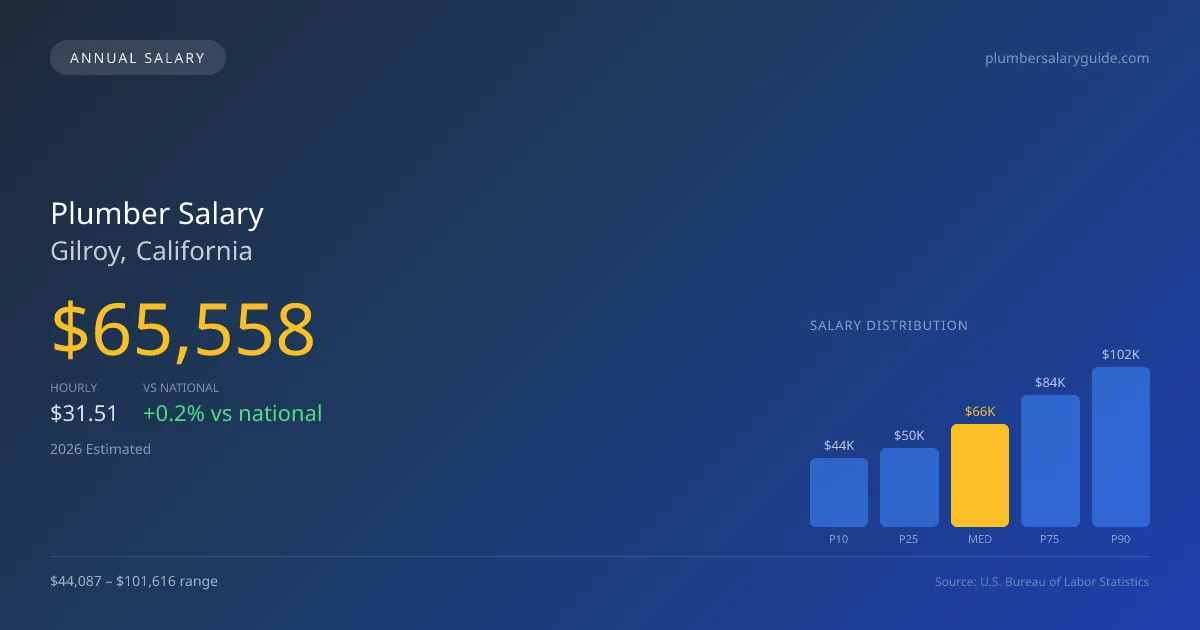
2026 Salary Percentile Distribution in Gilroy
In Gilroy, CA, the plumber salary spread from the 10th to 90th percentile is $57,529 (2026 est.). At $65,558, the local median is 0.23% above the national median of $65,408.
Salary Calculator
At 40 hours/week in Gilroy: You'd be in the lower-middle range
How Gilroy Plumber Pay Compares
Gilroy median: $65,558/year (2026)
| Compared To | Median Salary | Gilroy Pays |
|---|---|---|
| National Average | $65,408 | +0.23% more |
Plumbers in Gilroy, CA earn a median of $65,558 per year (2026 est.), which is 0.23% higher than the national median of $65,408.
Cost-of-Living Adjusted Salary
Gilroy has a cost of living 13.10% above the national average.
Adjusted salary = nominal × (100 / CoL index). CoL index: 100 = national average.
Gilroy, CA has a cost-of-living index of 113.1 (above the national average of 100). While the nominal salary of $65,558 is competitive, the higher cost of living reduces purchasing power to an effective $57,965 — a 11.58% reduction.
Compare Purchasing Power
Select a city to see how your salary compares after cost of living
Select a city above to compare purchasing power
2019 BLS Actual
$55,287
2025 BLS Actual
$63,947
2026 Current Est.
$65,558
2019–2027 Growth
+21.6%
Salary Trajectory for Plumbers in Gilroy (2019–2027)
2019–2025: actual BLS OEWS data for this metro area. 2026+: CAGR 2.52% projection.
| Year | Annual Salary | Status |
|---|---|---|
| 2019 | $55,287 | Actual |
| 2020 | $56,460 | Actual |
| 2021 | $60,018 | Actual |
| 2022 | $60,228 | Actual |
| 2023 | $61,692 | Actual |
| 2024 | $92,780 | Actual |
| 2025 | $63,947 | Actual |
| 2026(current) | $65,558 | Estimated |
| 2027 | $67,211 | Projected |
Based on 7 years of BLS OEWS data for the Gilroy metropolitan area, the median plumber salary grew 15.7% from $55,287 (2019) to $63,947 (2025). At a 2.52% compound annual growth rate, salaries are projected to reach $67,211 by 2027 — a total increase of $11,924 (21.57%) from 2019.
Note: Historical values (2019–2025) are actual BLS OEWS figures for the Gilroy metropolitan area, sourced from annual Occupational Employment and Wage Statistics surveys. 2026–2026 figures are current estimates, and 2027 values are projections, calculated using a 2.52% CAGR derived from 7-year BLS historical data. Actual salaries may vary based on employer, experience, certifications, and local market conditions.
Salary by Experience Level
| Experience | Estimated Salary Range |
|---|---|
| 0-2 years (New Graduate) | $44,087 – $50,123 |
| 3-5 years (Mid Career) | $50,123 – $65,558 |
| 5+ years (Experienced) | $65,558 – $83,915 |
| 10+ years (Top Earner) | $83,915 – $101,616 |
Plumber salary ranges estimated from BLS percentile data. Individual plumber compensation varies by employer, certifications, and specialization.
Plumber Job Market in Gilroy
Analyzing the local job market reveals that only 10 plumbers are employed in Gilroy, pointing to a specialized and potentially competitive environment. With a cost-of-living index of 113.1, earnings must stretch further, impacting purchasing power for plumbers in the area. Among local employers, union plumbing contractors typically offer the best pay, followed by industrial maintenance teams and larger service companies. The salary disparity can be attributed to various factors such as union affiliations, specialized skills in areas like medical gas installation, and the licensing requirements for contractual jobs. To maximize earnings in this market, plumbers should consider pursuing specialty certifications and gaining experience with municipal projects or self-employment, where the margins can be more favorable.
More salary data for Gilroy, CA:
Frequently Asked Questions
How much do plumbers make in Gilroy, CA in 2026?
Is Gilroy, CA a good place to work as a plumber?
Can plumbers make $100K in Gilroy?
What is the cost-of-living adjusted plumber salary in Gilroy?
How much does a plumber make per hour in Gilroy?
Related Pages
Compare Salaries
Career Resources
Nearby Cities in California
Written by Samuel Torres, CWP
Career Analyst
Samuel Torres has 10 years of experience in plumbing. He specializes in residential plumbing systems. He has worked with several home improvement companies.
Methodology & Data Source
Salary figures on this page are 2026 projections based on the Bureau of Labor Statistics Occupational Employment and Wage Statistics (OEWS) survey, May 2026 release. The BLS reported a median annual salary of $63,947 for plumbersin the Gilroy metropolitan area. A 2.52% compound annual growth rate (CAGR), calculated from 6-year national BLS wage trends, was applied to project current 2026 compensation. Percentile ranges (P10–P90) represent the full salary distribution across experience levels and practice settings in this market.
Data Sources & Methodology
Salary data for Gilroy is estimated from official BLS state-level occupational wage data (2025), adjusted for regional cost-of-living differences using BEA RPP (Regional Price Parities).
2026 figures are projected from 2025 BLS data using a compound annual growth rate (CAGR) of 2.52%, derived from historical BLS wage trends for plumbers (SOC 47-2152).
Compiled and verified by Samuel Torres, CWP, a licensed plumber with 10+ years of clinical experience. · View source data at BLS.gov