Plumber Salary in Garden Grove, CA: $67,014 (2026)
Quick Answer:A full-time plumber in Garden Grove, CA earns a median $67,014/year (≈ $32.22/hour) in nominal terms for 2026 — projected from BLS OEWS 2025 (SOC 47-2152). Once you factor in Garden Grove's price level (13% above national, BEA RPP 113.1), that paycheck buys what $59,252 would nationally. Nominal pay sits 2.3% above the California state average.
Based on BLS state-level estimates · View source
In 2026, plumbers in Garden Grove, California can expect to earn a median annual salary of $67,014. This figure not only surpasses the national median of $65,408 but also reflects the unique dynamics of the local market, characterized by a salary range from $44,124 at the 10th percentile to $103,872 at the 90th percentile. These projections are shaped by data derived from 2025 BLS figures, adjusted for regional price variations. Additionally, the potential for specialized skills, such as medical gas certification or expertise in underground utilities, can significantly enhance earning potential, making differentiation through credentials particularly valuable in a competitive job market in Garden Grove.
About the Garden Grove Market
Salary estimated from California average ($82,000) adjusted for local cost of living.
Salary Breakdown
| Percentile | Annual | Hourly |
|---|---|---|
| Entry Level (P10) | $44,124 | $21.21 |
| Lower Range (P25) | $50,890 | $24.46 |
| Median (P50)(typical) | $67,014 | $32.22 |
| Upper Range (P75) | $85,778 | $41.24 |
| Top Earners (P90) | $103,872 | $49.94 |
Median Salary Position
2.46% above the national average
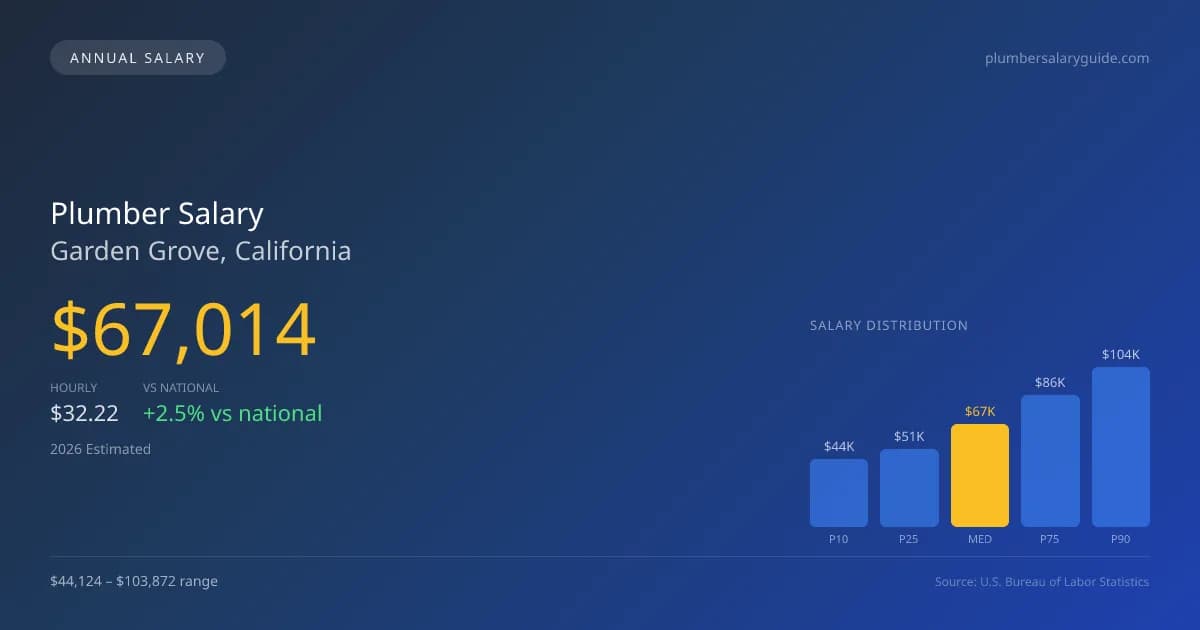
2026 Salary Percentile Distribution in Garden Grove
In Garden Grove, CA, the plumber salary spread from the 10th to 90th percentile is $59,748 (2026 est.). At $67,014, the local median is 2.46% above the national median of $65,408.
Salary Calculator
At 40 hours/week in Garden Grove: You'd be in the lower-middle range
How Garden Grove Plumber Pay Compares
Garden Grove median: $67,014/year (2026)
| Compared To | Median Salary | Garden Grove Pays |
|---|---|---|
| California Average | $65,508 | +2.30% more |
| National Average | $65,408 | +2.46% more |
Plumbers in Garden Grove, CA earn a median of $67,014 per year (2026 est.), which is 2.46% higher than the national median of $65,408 and 2.30% above the California state average of $65,508.
Cost-of-Living Adjusted Salary
Garden Grove has a cost of living 13.10% above the national average.
Adjusted salary = nominal × (100 / CoL index). CoL index: 100 = national average.
Garden Grove, CA has a cost-of-living index of 113.1 (above the national average of 100). While the nominal salary of $67,014 is competitive, the higher cost of living reduces purchasing power to an effective $59,252 — a 11.58% reduction.
Compare Purchasing Power
Select a city to see how your salary compares after cost of living
Select a city above to compare purchasing power
2019 BLS Actual
$56,515
2025 BLS Actual
$65,367
2026 Current Est.
$67,014
2019–2027 Growth
+21.6%
Salary Trajectory for Plumbers in Garden Grove (2019–2027)
2019–2025: actual BLS OEWS data for this metro area. 2026+: CAGR 2.52% projection.
| Year | Annual Salary | Status |
|---|---|---|
| 2019 | $56,515 | Actual |
| 2020 | $57,714 | Actual |
| 2021 | $61,351 | Actual |
| 2022 | $61,566 | Actual |
| 2023 | $63,062 | Actual |
| 2024 | $94,842 | Actual |
| 2025 | $65,367 | Actual |
| 2026(current) | $67,014 | Estimated |
| 2027 | $68,703 | Projected |
Based on 7 years of BLS OEWS data for the Garden Grove metropolitan area, the median plumber salary grew 15.7% from $56,515 (2019) to $65,367 (2025). At a 2.52% compound annual growth rate, salaries are projected to reach $68,703 by 2027 — a total increase of $12,188 (21.57%) from 2019.
Note: Historical values (2019–2025) are actual BLS OEWS figures for the Garden Grove metropolitan area, sourced from annual Occupational Employment and Wage Statistics surveys. 2026–2026 figures are current estimates, and 2027 values are projections, calculated using a 2.52% CAGR derived from 7-year BLS historical data. Actual salaries may vary based on employer, experience, certifications, and local market conditions.
Salary by Experience Level
| Experience | Estimated Salary Range |
|---|---|
| 0-2 years (New Graduate) | $44,124 – $50,890 |
| 3-5 years (Mid Career) | $50,890 – $67,014 |
| 5+ years (Experienced) | $67,014 – $85,778 |
| 10+ years (Top Earner) | $85,778 – $103,872 |
Plumber salary ranges estimated from BLS percentile data. Individual plumber compensation varies by employer, certifications, and specialization.
Plumber Job Market in Garden Grove
The plumbing job market in Garden Grove employs about 37 professionals, indicating a localized demand for skilled labor against a backdrop of an above-average cost of living index of 113.1. This reality suggests that take-home pay may stretch less far than in areas with lower living costs. Local employers with the highest pay tend to be union contractors affiliated with the UA, which generally offer more favorable wage structures compared to non-union shops. Other lucrative opportunities also exist in government utility positions and large service companies, where the pay structures often include commission and overtime. The disparity in salaries is influenced by various factors, including union benefits, specialty skills, and additional licensing that allow for higher earning potential, particularly in high-demand areas like medical gas installations. To maximize compensation in the Garden Grove market, plumbers should consider pursuing advanced certifications and negotiating for roles that offer both base pay and performance incentives.
More salary data for Garden Grove, CA:
Frequently Asked Questions
How much do plumbers make in Garden Grove, CA in 2026?
Is Garden Grove, CA a good place to work as a plumber?
Can plumbers make $100K in Garden Grove?
What is the cost-of-living adjusted plumber salary in Garden Grove?
How much does a plumber make per hour in Garden Grove?
Related Pages
Compare Salaries
Career Resources
Nearby Cities in California
Written by Samuel Torres, CWP
Career Analyst
Samuel Torres has 10 years of experience in plumbing. He specializes in residential plumbing systems. He has worked with several home improvement companies.
Methodology & Data Source
Salary figures on this page are 2026 projections based on the Bureau of Labor Statistics Occupational Employment and Wage Statistics (OEWS) survey, May 2026 release. The BLS reported a median annual salary of $65,367 for plumbersin the Garden Grove metropolitan area. A 2.52% compound annual growth rate (CAGR), calculated from 6-year national BLS wage trends, was applied to project current 2026 compensation. Percentile ranges (P10–P90) represent the full salary distribution across experience levels and practice settings in this market.
Data Sources & Methodology
Salary data for Garden Grove is estimated from official BLS state-level occupational wage data (2025), adjusted for regional cost-of-living differences using BEA RPP (Regional Price Parities).
2026 figures are projected from 2025 BLS data using a compound annual growth rate (CAGR) of 2.52%, derived from historical BLS wage trends for plumbers (SOC 47-2152).
Compiled and verified by Samuel Torres, CWP, a licensed plumber with 10+ years of clinical experience. · View source data at BLS.gov