Plumber Salary in Folsom, CA: $67,305 (2026)
Quick Answer:A full-time plumber in Folsom, CA earns a median $67,305/year (≈ $32.36/hour) in nominal terms for 2026 — projected from BLS OEWS 2025 (SOC 47-2152). Once you factor in Folsom's price level (13% above national, BEA RPP 113.1), that paycheck buys what $59,509 would nationally. Nominal pay sits 2.7% above the California state average.
Based on BLS state-level estimates · View source
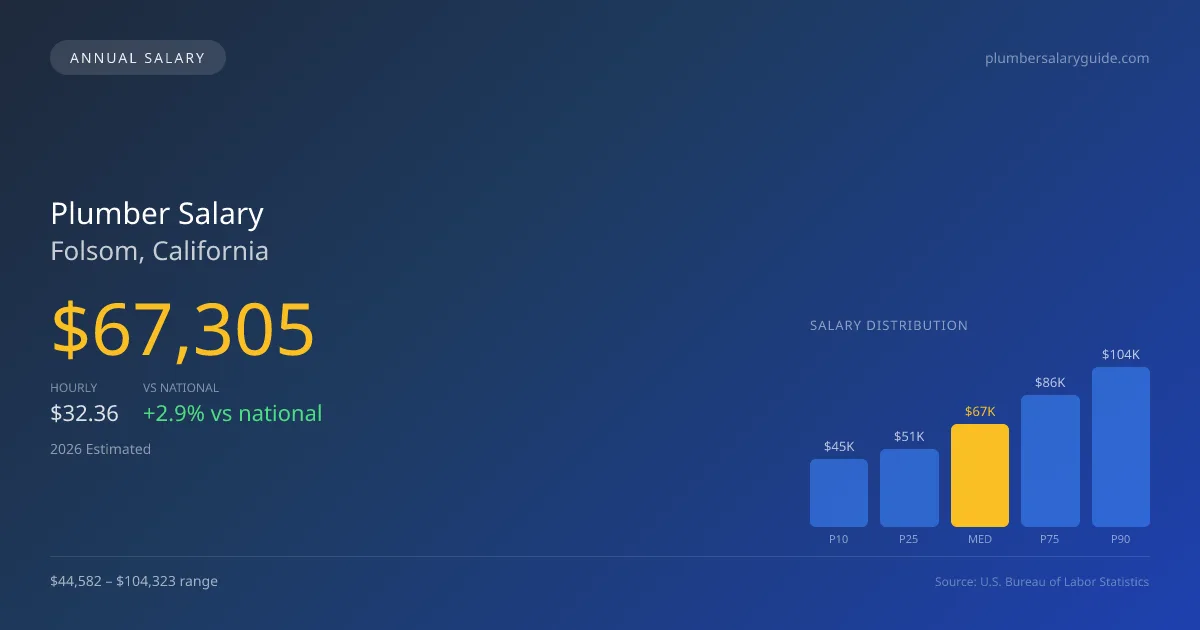
In 2026, the projected median annual salary for plumbers in Folsom, California, stands at $67,305, slightly exceeding the national median of $65,408 by about 2.90%. Local salaries show a range from $44,582 at the lower end (10th percentile) to a top figure of $104,323 at the 90th percentile, which highlights significant earning potential. These estimates, drawn from BLS state-level data and adjusted for regional price parities, indicate that apprentices and licensed plumbers can achieve a favorable income, particularly when pursuing specialty certifications like medical gas or backflow prevention. Such credentials can lead to premium pay, making Folsom an appealing market for skilled plumbers preparing to capitalize on the area's demand for reliable plumbing services.
About the Folsom Market
Salary estimated from California average ($82,000) adjusted for local cost of living.
Salary Breakdown
| Percentile | Annual | Hourly |
|---|---|---|
| Entry Level (P10) | $44,582 | $21.44 |
| Lower Range (P25) | $51,154 | $24.59 |
| Median (P50)(typical) | $67,305 | $32.36 |
| Upper Range (P75) | $86,151 | $41.42 |
| Top Earners (P90) | $104,323 | $50.15 |
Median Salary Position
2.90% above the national average
2026 Salary Percentile Distribution in Folsom
In Folsom, CA, the plumber salary spread from the 10th to 90th percentile is $59,741 (2026 est.). At $67,305, the local median is 2.9% above the national median of $65,408.
Salary Calculator
At 40 hours/week in Folsom: You'd be in the lower-middle range
How Folsom Plumber Pay Compares
Folsom median: $67,305/year (2026)
| Compared To | Median Salary | Folsom Pays |
|---|---|---|
| California Average | $65,536 | +2.70% more |
| National Average | $65,408 | +2.90% more |
Plumbers in Folsom, CA earn a median of $67,305 per year (2026 est.), which is 2.90% higher than the national median of $65,408 and 2.70% above the California state average of $65,536.
Cost-of-Living Adjusted Salary
Folsom has a cost of living 13.10% above the national average.
Adjusted salary = nominal × (100 / CoL index). CoL index: 100 = national average.
Folsom, CA has a cost-of-living index of 113.1 (above the national average of 100). While the nominal salary of $67,305 is competitive, the higher cost of living reduces purchasing power to an effective $59,509 — a 11.58% reduction.
Compare Purchasing Power
Select a city to see how your salary compares after cost of living
Select a city above to compare purchasing power
2019 BLS Actual
$56,760
2025 BLS Actual
$65,651
2026 Current Est.
$67,305
2019–2027 Growth
+21.6%
Salary Trajectory for Plumbers in Folsom (2019–2027)
2019–2025: actual BLS OEWS data for this metro area. 2026+: CAGR 2.52% projection.
| Year | Annual Salary | Status |
|---|---|---|
| 2019 | $56,760 | Actual |
| 2020 | $57,964 | Actual |
| 2021 | $61,617 | Actual |
| 2022 | $61,833 | Actual |
| 2023 | $63,336 | Actual |
| 2024 | $92,435 | Actual |
| 2025 | $65,651 | Actual |
| 2026(current) | $67,305 | Estimated |
| 2027 | $69,002 | Projected |
Based on 7 years of BLS OEWS data for the Folsom metropolitan area, the median plumber salary grew 15.7% from $56,760 (2019) to $65,651 (2025). At a 2.52% compound annual growth rate, salaries are projected to reach $69,002 by 2027 — a total increase of $12,242 (21.57%) from 2019.
Note: Historical values (2019–2025) are actual BLS OEWS figures for the Folsom metropolitan area, sourced from annual Occupational Employment and Wage Statistics surveys. 2026–2026 figures are current estimates, and 2027 values are projections, calculated using a 2.52% CAGR derived from 7-year BLS historical data. Actual salaries may vary based on employer, experience, certifications, and local market conditions.
Salary by Experience Level
| Experience | Estimated Salary Range |
|---|---|
| 0-2 years (New Graduate) | $44,582 – $51,154 |
| 3-5 years (Mid Career) | $51,154 – $67,305 |
| 5+ years (Experienced) | $67,305 – $86,151 |
| 10+ years (Top Earner) | $86,151 – $104,323 |
Plumber salary ranges estimated from BLS percentile data. Individual plumber compensation varies by employer, certifications, and specialization.
Plumber Job Market in Folsom
Folsom's plumbing job market supports only 17 employed plumbers, suggesting a relatively stable, though niche, environment. Given the cost-of-living index standing at 113.1, the higher living expenses in the area necessitate substantial take-home pay. Notably, unionized plumbers affiliated with the UA can expect wages that considerably outpace those in non-union shops, as union pay scales often run 30-50% higher, especially for those in industrial maintenance roles. Strong industry demand, driven by aging infrastructure and a workforce with a median age exceeding 50, propels salaries upward. Navigating this market requires strategic choices; seeking union opportunities, acquiring specialty licenses, and considering self-employment can maximize earning potential in Folsom. The spread in plumber pay here is largely influenced by factors such as specialization in medical gas work, the ownership of master and contractor licenses, and the commission-based income of service roles at companies like Roto-Rooter or ARS/Rescue Rooter.
More salary data for Folsom, CA:
Frequently Asked Questions
How much do plumbers make in Folsom, CA in 2026?
Is Folsom, CA a good place to work as a plumber?
Can plumbers make $100K in Folsom?
What is the cost-of-living adjusted plumber salary in Folsom?
How much does a plumber make per hour in Folsom?
Related Pages
Compare Salaries
Career Resources
Nearby Cities in California
Written by Samuel Torres, CWP
Career Analyst
Samuel Torres has 10 years of experience in plumbing. He specializes in residential plumbing systems. He has worked with several home improvement companies.
Methodology & Data Source
Salary figures on this page are 2026 projections based on the Bureau of Labor Statistics Occupational Employment and Wage Statistics (OEWS) survey, May 2026 release. The BLS reported a median annual salary of $65,651 for plumbersin the Folsom metropolitan area. A 2.52% compound annual growth rate (CAGR), calculated from 6-year national BLS wage trends, was applied to project current 2026 compensation. Percentile ranges (P10–P90) represent the full salary distribution across experience levels and practice settings in this market.
Data Sources & Methodology
Salary data for Folsom is estimated from official BLS state-level occupational wage data (2025), adjusted for regional cost-of-living differences using BEA RPP (Regional Price Parities).
2026 figures are projected from 2025 BLS data using a compound annual growth rate (CAGR) of 2.52%, derived from historical BLS wage trends for plumbers (SOC 47-2152).
Compiled and verified by Samuel Torres, CWP, a licensed plumber with 10+ years of clinical experience. · View source data at BLS.gov