Plumber Salary in Bakersfield, CA: $68,125 (2026)
Quick Answer:A full-time plumber in Bakersfield, CA earns a median $68,125/year (≈ $32.76/hour) in nominal terms for 2026 — projected from BLS OEWS 2025 (SOC 47-2152). Once you factor in Bakersfield's price level (1% above national, BEA RPP 100.9), that paycheck buys what $67,527 would nationally. Nominal pay sits 4.0% above the California state average.
Official BLS data · View source
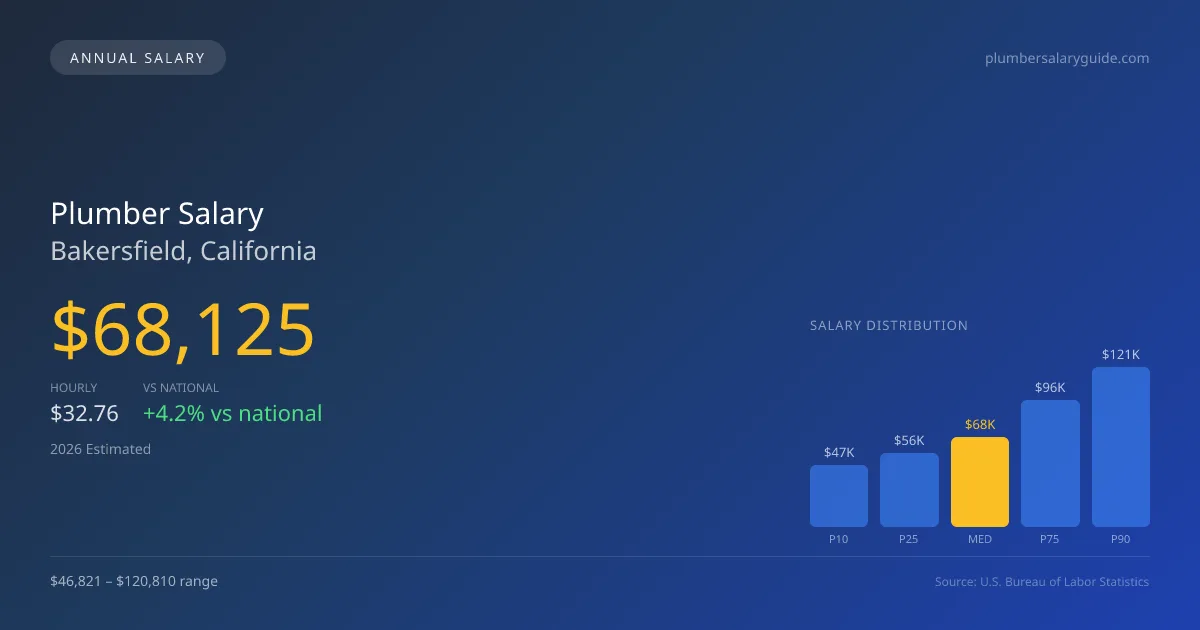
In Bakersfield, California, the plumber salary is projected to reach a median of $68,125 in 2026, marking a notable 4.15% increase over the national average of $65,408. Plumbers in this area can expect to earn between $46,821 and $120,810, reflecting a diverse pay scale influenced by union and non-union dynamics. Union pipefitters affiliated with the United Association (UA) typically enjoy a significant wage premium, often earning 30-50% more than their non-union counterparts in service plumbing. These projections stem from official Bureau of Labor Statistics (BLS) Occupational Employment and Wage Statistics (OEWS) data, painting a comprehensive picture of the local plumbing job market.
Salary Breakdown
| Percentile | Annual | Hourly |
|---|---|---|
| Entry Level (P10) | $46,821 | $22.51 |
| Lower Range (P25) | $55,935 | $26.89 |
| Median (P50)(typical) | $68,125 | $32.76 |
| Upper Range (P75) | $96,174 | $46.24 |
| Top Earners (P90) | $120,810 | $58.08 |
Median Salary Position
4.15% above the national average
2026 Salary Percentile Distribution in Bakersfield
In Bakersfield, CA, the plumber salary spread from the 10th to 90th percentile is $73,989 (2026 est.). At $68,125, the local median is 4.15% above the national median of $65,408.
Salary Calculator
At 40 hours/week in Bakersfield: You'd be in the lower-middle range
How Bakersfield Plumber Pay Compares
Bakersfield median: $68,125/year (2026)
| Compared To | Median Salary | Bakersfield Pays |
|---|---|---|
| California Average | $65,504 | +4.00% more |
| National Average | $65,408 | +4.15% more |
Plumbers in Bakersfield, CA earn a median of $68,125 per year (2026 est.), which is 4.15% higher than the national median of $65,408 and 4.00% above the California state average of $65,504.
Cost-of-Living Adjusted Salary
Bakersfield has a cost of living 0.89% above the national average.
Adjusted salary = nominal × (100 / CoL index). CoL index: 100 = national average.
Bakersfield, CA has a cost-of-living index of 100.886 (above the national average of 100). While the nominal salary of $68,125 is competitive, the higher cost of living reduces purchasing power to an effective $67,527 — a 0.88% reduction.
Compare Purchasing Power
Select a city to see how your salary compares after cost of living
Select a city above to compare purchasing power
2019 BLS Actual
$53,470
2025 BLS Actual
$66,450
2026 Current Est.
$68,125
2019–2027 Growth
+30.6%
Salary Trajectory for Plumbers in Bakersfield (2019–2027)
2019–2025: actual BLS OEWS data for this metro area. 2026+: CAGR 2.52% projection.
| Year | Annual Salary | Status |
|---|---|---|
| 2019 | $53,470 | Actual |
| 2020 | $57,680 | Actual |
| 2021 | $61,030 | Actual |
| 2022 | $59,530 | Actual |
| 2023 | $58,860 | Actual |
| 2024 | $71,360 | Actual |
| 2025 | $66,450 | Actual |
| 2026(current) | $68,125 | Estimated |
| 2027 | $69,841 | Projected |
Based on 7 years of BLS OEWS data for the Bakersfield metropolitan area, the median plumber salary grew 24.3% from $53,470 (2019) to $66,450 (2025). At a 2.52% compound annual growth rate, salaries are projected to reach $69,841 by 2027 — a total increase of $16,371 (30.62%) from 2019.
Note: Historical values (2019–2025) are actual BLS OEWS figures for the Bakersfield metropolitan area, sourced from annual Occupational Employment and Wage Statistics surveys. 2026–2026 figures are current estimates, and 2027 values are projections, calculated using a 2.52% CAGR derived from 7-year BLS historical data. Actual salaries may vary based on employer, experience, certifications, and local market conditions.
Salary by Experience Level
| Experience | Estimated Salary Range |
|---|---|
| 0-2 years (New Graduate) | $46,821 – $55,935 |
| 3-5 years (Mid Career) | $55,935 – $68,125 |
| 5+ years (Experienced) | $68,125 – $96,174 |
| 10+ years (Top Earner) | $96,174 – $120,810 |
Plumber salary ranges estimated from BLS percentile data. Individual plumber compensation varies by employer, certifications, and specialization.
Plumber Job Market in Bakersfield
With approximately 960 plumbers employed in Bakersfield, the local job market demonstrates solid demand amidst a cost of living index at 100.886. This slightly elevated cost of living means take-home pay can fluctuate, compelling plumbers to seek advantageous employment arrangements. Union plumbing contractors usually offer the highest compensation, particularly for specialized skills such as medical gas installation. Meanwhile, non-union contractors and large service companies like Roto-Rooter present distinct opportunities for income, especially when commission structures come into play. Variations in pay arise from factors such as skill specialization, licensing (master and contractor), and overtime opportunities. To maximize earnings, plumbers should consider acquiring specialty credentials, navigating the trade towards high-demand areas, and remaining adaptable to both service and construction fields to ensure they capitalize on the diverse opportunities within Bakersfield's plumbing market.
More salary data for Bakersfield, CA:
Frequently Asked Questions
How much do plumbers make in Bakersfield, CA in 2026?
Is Bakersfield, CA a good place to work as a plumber?
Can plumbers make $100K in Bakersfield?
What is the cost-of-living adjusted plumber salary in Bakersfield?
How much does a plumber make per hour in Bakersfield?
Related Pages
Compare Salaries
Career Resources
Nearby Cities in California
Written by Samuel Torres, CWP
Career Analyst
Samuel Torres has 10 years of experience in plumbing. He specializes in residential plumbing systems. He has worked with several home improvement companies.
Methodology & Data Source
Salary figures on this page are 2026 projections based on the Bureau of Labor Statistics Occupational Employment and Wage Statistics (OEWS) survey, May 2026 release. The BLS reported a median annual salary of $66,450 for plumbersin the Bakersfield metropolitan area. A 2.52% compound annual growth rate (CAGR), calculated from 6-year national BLS wage trends, was applied to project current 2026 compensation. Percentile ranges (P10–P90) represent the full salary distribution across experience levels and practice settings in this market.
Data Sources & Methodology
Source: BLS, OEWS, 7-year dataset (–). Per-city data from annual BLS metropolitan area surveys.
2026 figures are projected from 2025 BLS data using a compound annual growth rate (CAGR) of 2.52%, derived from historical BLS wage trends for plumbers (SOC 47-2152).
Compiled and verified by Samuel Torres, CWP, a licensed plumber with 10+ years of clinical experience. · View source data at BLS.gov