Plumber Salary in Apple Valley, CA: $65,101 (2026)
Quick Answer:A full-time plumber in Apple Valley, CA earns a median $65,101/year (≈ $31.30/hour) in nominal terms for 2026 — projected from BLS OEWS 2025 (SOC 47-2152). Once you factor in Apple Valley's price level (13% above national, BEA RPP 113.1), that paycheck buys what $57,561 would nationally. Nominal pay sits 0.7% below the California state average.
Based on BLS state-level estimates · View source
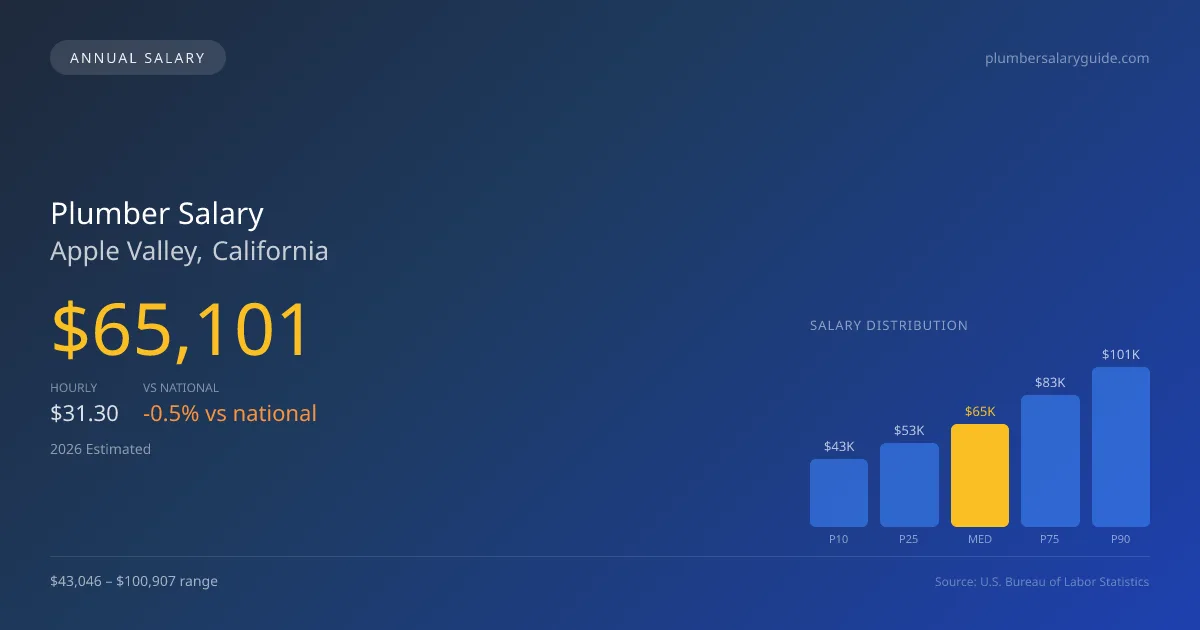
In 2026, plumbers in Apple Valley, CA, can expect to earn a median annual salary of $65,101, slightly lower than the national median of $65,408. The salary range for this occupation spans from $43,046 at the 10th percentile to $100,907 at the 90th percentile. These figures are derived from state-level data and adjusted for local cost-of-living factors. A significant aspect of the plumbing market in Apple Valley is the prevalent pay gap between union pipefitters, who often enjoy a substantial wage premium, and non-union service plumbers, whose earnings tend to be more variable. Understanding this distinction is crucial for professionals navigating the job market in this region.
About the Apple Valley Market
Salary estimated from California average ($82,000) adjusted for local cost of living.
Salary Breakdown
| Percentile | Annual | Hourly |
|---|---|---|
| Entry Level (P10) | $43,046 | $20.70 |
| Lower Range (P25) | $53,129 | $25.54 |
| Median (P50)(typical) | $65,101 | $31.30 |
| Upper Range (P75) | $83,329 | $40.06 |
| Top Earners (P90) | $100,907 | $48.51 |
Median Salary Position
0.47% below the national average
2026 Salary Percentile Distribution in Apple Valley
In Apple Valley, CA, the plumber salary spread from the 10th to 90th percentile is $57,861 (2026 est.). At $65,101, the local median is 0.47% below the national median of $65,408.
Salary Calculator
At 40 hours/week in Apple Valley: You'd be in the lower-middle range
How Apple Valley Plumber Pay Compares
Apple Valley median: $65,101/year (2026)
| Compared To | Median Salary | Apple Valley Pays |
|---|---|---|
| California Average | $65,560 | -0.70% less |
| National Average | $65,408 | -0.47% less |
Plumbers in Apple Valley, CA earn a median of $65,101 per year (2026 est.), which is 0.47% lower than the national median of $65,408 and 0.70% below the California state average of $65,560.
Cost-of-Living Adjusted Salary
Apple Valley has a cost of living 13.10% above the national average.
Adjusted salary = nominal × (100 / CoL index). CoL index: 100 = national average.
Apple Valley, CA has a cost-of-living index of 113.1 (above the national average of 100). While the nominal salary of $65,101 is competitive, the higher cost of living reduces purchasing power to an effective $57,561 — a 11.58% reduction.
Compare Purchasing Power
Select a city to see how your salary compares after cost of living
Select a city above to compare purchasing power
2019 BLS Actual
$54,901
2025 BLS Actual
$63,501
2026 Current Est.
$65,101
2019–2027 Growth
+21.6%
Salary Trajectory for Plumbers in Apple Valley (2019–2027)
2019–2025: actual BLS OEWS data for this metro area. 2026+: CAGR 2.52% projection.
| Year | Annual Salary | Status |
|---|---|---|
| 2019 | $54,901 | Actual |
| 2020 | $56,066 | Actual |
| 2021 | $59,599 | Actual |
| 2022 | $59,808 | Actual |
| 2023 | $61,262 | Actual |
| 2024 | $92,134 | Actual |
| 2025 | $63,501 | Actual |
| 2026(current) | $65,101 | Estimated |
| 2027 | $66,742 | Projected |
Based on 7 years of BLS OEWS data for the Apple Valley metropolitan area, the median plumber salary grew 15.7% from $54,901 (2019) to $63,501 (2025). At a 2.52% compound annual growth rate, salaries are projected to reach $66,742 by 2027 — a total increase of $11,841 (21.57%) from 2019.
Note: Historical values (2019–2025) are actual BLS OEWS figures for the Apple Valley metropolitan area, sourced from annual Occupational Employment and Wage Statistics surveys. 2026–2026 figures are current estimates, and 2027 values are projections, calculated using a 2.52% CAGR derived from 7-year BLS historical data. Actual salaries may vary based on employer, experience, certifications, and local market conditions.
Salary by Experience Level
| Experience | Estimated Salary Range |
|---|---|
| 0-2 years (New Graduate) | $43,046 – $53,129 |
| 3-5 years (Mid Career) | $53,129 – $65,101 |
| 5+ years (Experienced) | $65,101 – $83,329 |
| 10+ years (Top Earner) | $83,329 – $100,907 |
Plumber salary ranges estimated from BLS percentile data. Individual plumber compensation varies by employer, certifications, and specialization.
Plumber Job Market in Apple Valley
The local job market for plumbers in Apple Valley is relatively small, with only 19 plumbers currently employed. This limited workforce exists amidst a cost-of-living index of 113.1, suggesting that higher wages are essential for maintaining purchasing power. Among the employers, UA union contractors typically offer the highest pay, followed by specialized roles such as medical gas and industrial pipefitters. Non-union and residential roles may vary more significantly, reflecting market dynamics and service demands. The wide salary range is influenced by factors like specialty skills, employment type, and commission structures common in service companies. To maximize earnings in this competitive environment, plumbers should consider obtaining additional certifications, such as medical gas, and seek opportunities within union shops where wages tend to be more competitive, ensuring they remain relevant in a market with a significant aging workforce.
More salary data for Apple Valley, CA:
Frequently Asked Questions
How much do plumbers make in Apple Valley, CA in 2026?
Is Apple Valley, CA a good place to work as a plumber?
Can plumbers make $100K in Apple Valley?
What is the cost-of-living adjusted plumber salary in Apple Valley?
How much does a plumber make per hour in Apple Valley?
Related Pages
Compare Salaries
Career Resources
Nearby Cities in California
Written by Samuel Torres, CWP
Career Analyst
Samuel Torres has 10 years of experience in plumbing. He specializes in residential plumbing systems. He has worked with several home improvement companies.
Methodology & Data Source
Salary figures on this page are 2026 projections based on the Bureau of Labor Statistics Occupational Employment and Wage Statistics (OEWS) survey, May 2026 release. The BLS reported a median annual salary of $63,501 for plumbersin the Apple Valley metropolitan area. A 2.52% compound annual growth rate (CAGR), calculated from 6-year national BLS wage trends, was applied to project current 2026 compensation. Percentile ranges (P10–P90) represent the full salary distribution across experience levels and practice settings in this market.
Data Sources & Methodology
Salary data for Apple Valley is estimated from official BLS state-level occupational wage data (2025), adjusted for regional cost-of-living differences using BEA RPP (Regional Price Parities).
2026 figures are projected from 2025 BLS data using a compound annual growth rate (CAGR) of 2.52%, derived from historical BLS wage trends for plumbers (SOC 47-2152).
Compiled and verified by Samuel Torres, CWP, a licensed plumber with 10+ years of clinical experience. · View source data at BLS.gov